November 2014 SREC Pricing Update and Auction Results

Posted November 6th, 2014 by SRECTrade.

As of November 4, 2014, below is a summary of indicative pricing across the SREC markets SRECTrade covers (for a PDF copy click here). For November 2014 auction results, scroll down.

Screenshot_110414_084844_PM

Note: All pricing and notes included are indicative and subject to change. Please contact us for most current markets. If a market is not quoted herein, please contact us directly for further information. 

SRECTrade’s November 2014 SREC Auction closed on 11/4/2014. The clearing prices presented below are representative of transactions executed through the SRECTrade auction. This does not include over the counter spot and forward contract transactions completed through SRECTrade’s brokerage desk. For more information on our brokerage services for corporate clients please click here. Below are the clearing prices by vintage across the SRECs transacted in the auction.

Auction Prices SREC Vintage Year
State 2012 2013 2014 2015
Delaware N/A N/A N/A N/A
Maryland N/A $130.00 $135.00 N/A
Massachusetts SREC-I N/A N/A $274.01 N/A
New Jersey $160.50 $168.01 $178.00 $183.00
Ohio Sited $22.71 $22.71 $30.00 N/A
Ohio Adjacent N/A N/A $30.00 N/A
Pennsylvania N/A $22.55 $35.00 $33.00
Washington, DC N/A N/A $485.00 N/A

The next SRECTrade auction for the PJM and MA SREC markets will close on Tuesday, December 2, 2014 at 5 p.m. ET.

This document is protected by copyright laws and contains material proprietary to SRECTrade, Inc. It or any components may not be reproduced, republished, distributed, transmitted, displayed, broadcast or otherwise exploited in any manner without the express prior written permission of SRECTrade, Inc. The receipt or possession of this document does not convey any rights to reproduce, disclose, or distribute its contents, or to manufacture, use, or sell anything that it may describe, in whole or in part. If consent to use these materials is granted, a link to the current version of this document on the SRECTrade website must be included for reference.

SRECTrade Markets Report: September 2014

Posted October 21st, 2014 by SRECTrade.

The following post is a monthly update outlining the megawatts of solar capacity certified to create SRECs in the Solar REC markets that SRECTrade serves. All PJM data is based on the information available in PJM GATS as of the date noted. All MA data is based on the information provided by the DOER as of the date noted. This analysis does not include projects that are not yet registered and certified with the entities noted herein.

A PDF copy of this table can be found here.

Capacity_September2014

Overview of PJM Eligible Systems Through 10/19/2014

There are 50,709 facilities registered in GATS as of 10/19/2014. See below for a more detailed breakdown.

PJM overview sept 14

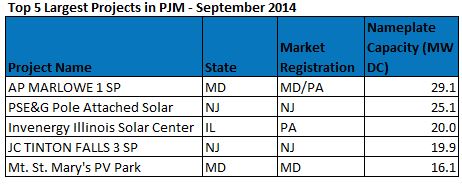
There are 294 projects over 1 MW in capacity (up four from August), representing 861.2 MW or 43.7% of the qualified capacity. The largest projects in PJM are concentrated in NJ and MD. There are 38 projects over 5 MW or larger. These make up 18.9% of all qualified capacity in PJM. The top 5 largest projects are listed below.

top largest sept 14

NJ Office of Clean Energy Estimated Installed Capacity Through 9/30/14

On October 14, 2014, the New Jersey Office of Clean Energy (OCE) announced total installed solar capacity reached 1,354.0 MW through 9/30/14; an increase of approximately 9.3 MW over the total capacity reported through the end of August 2014. The average last six month build rate per month, according to the OCE data, is 14.5 MW. Note that this data does not directly tie to GATS registration data because of a lag between NJ Office of Clean Energy certifications and GATS registrations.

Overview of MA DOER SREC-I and SREC-II Eligible Systems

SREC-I Program

The Massachusetts SREC-I program was capped on June 30, 2014, however 62.3 MW of solar is still listed as Qualified but not operational on an update report issued by the DOER on 10/7/2014. In total, 656.2 MW of capacity is listed as currently qualified, of which 593.9 MW of capacity is operational.

SREC-II Program

The SREC-II program opened on April 25, 2014. The program is broken in to Market Sectors. For a detailed overview of the regulations regarding SREC-II please visit here. As of 10/8/2014, 146.5 MW of capacity is currently qualified under the SREC-II program, but only 27.5 MW is operational.

How to Interpret The Capacity Table at the Top of this Post

The tables above demonstrate the capacity breakout by state. Note, that for all PJM GATS registered projects, each state includes all projects certified to sell into that state. State RPS programs that allow for systems sited in other states to participate have been broken up by systems sited in-state and out-of-state. Additional detail has been provided to demonstrate the total capacity of systems only certified for one specific state market versus being certified for multiple state markets. For example, PA includes projects only certified to sell into the PA SREC market, broken out by in-state and out-of-state systems, as well as projects that are also certified to sell into PA and Other State markets broken out by in state and out of state systems (i.e. OH, DC, MD, DE, NJ). PA Out-of-State includes systems sited in states with their own state SREC market (i.e. DE) as well as systems sited in states that have no SREC market (i.e. VA). Also, it is important to note that the Current Capacity represents the total megawatts eligible to produce and sell SRECs as of the noted date, while the Estimated Required Capacity – Current and Next Reporting Year represents the estimated number of MW that need to be online on average throughout the reporting period to meet the RPS requirement within each state with only that particular compliance period vintage. For example, New Jersey needed approximately 496.7 MW online for the entire 2013 reporting year to meet the RPS requirement with 2013 vintage SRECs only. SRECs still available from prior eligible periods can also impact the Solar RPS requirements. Additionally, the data presented above does not include projects that are in the pipeline or currently going through the registration process in each state program. This data represents specifically the projects that have been approved for the corresponding state SREC markets as of the dates noted.

Note: SREC requirements for markets without fixed SREC targets have been forecast based on EIA Report “Retail Sales of Electricity by State by Provider” updated 11/8/13. Projected SRECs required utilizes the most recent EIA electricity data applying an average 1.5% growth rate per forecast year. The state’s RPS Solar requirement is then multiplied by forecast total electricity sales to arrive at projected SRECs required. Projected capacity required is based on a factor of 1,200 MWh in PJM states and 1,160 MWh in MA, generated per MW of installed capacity per year.

October 2014 SREC Pricing Update and Auction Results

Posted October 3rd, 2014 by SRECTrade.

As of October 2, 2014, below is a summary of indicative pricing across the SREC markets SRECTrade covers (for a PDF copy click here). For October 2014 auction results, scroll down.

10-2-14 pricing summary

Note: All pricing and notes included are indicative and subject to change. Please contact us for most current markets. If a market is not quoted herein, please contact us directly for further information. 

SRECTrade’s October 2014 SREC Auction closed on 10/2/2014. The clearing prices presented below are representative of transactions executed through the SRECTrade auction. This does not include over the counter spot and forward contract transactions completed through SRECTrade’s brokerage desk. For more information on our brokerage services for corporate clients please click here. Below are the clearing prices by vintage across the SRECs transacted in the auction.

Auction Prices SREC Vintage Year
State 2012 2013 2014 2015
Delaware N/A N/A N/A N/A
Maryland $120.55 $125.01 $131.03 N/A
Massachusetts SREC-I N/A N/A N/A N/A
New Jersey N/A N/A $170.00 $172.50
Ohio Sited N/A N/A $26.00 N/A
Ohio Adjacent N/A N/A $26.00 N/A
Pennsylvania N/A $20.55 $26.55 $32.00
Washington, DC N/A N/A $481.00 N/A

The next SRECTrade auction for the PJM and MA SREC markets will close on Tuesday, November 4th, 2014 at 5 p.m. ET.

This document is protected by copyright laws and contains material proprietary to SRECTrade, Inc. It or any components may not be reproduced, republished, distributed, transmitted, displayed, broadcast or otherwise exploited in any manner without the express prior written permission of SRECTrade, Inc. The receipt or possession of this document does not convey any rights to reproduce, disclose, or distribute its contents, or to manufacture, use, or sell anything that it may describe, in whole or in part. If consent to use these materials is granted, a link to the current version of this document on the SRECTrade website must be included for reference.

MA DOER Revises 2016 Managed Growth SREC-II Capacity

Posted September 18th, 2014 by SRECTrade.

On September 18, 2014, the Massachusetts Department of Energy Resources announced a revision to the Managed Growth allocation for 2016. The DOER explains that after “a careful review of all the comments received, DOER determined that some valid arguments existed for scaling back its initial projections, and therefore decided to make some alterations to its analysis.”

The net result is a 20 MW allocation to the Managed Growth sector for 2016. Initially, DOER indicated the allocation would be zero when the first analysis was published on August 26.

SRECTrade Markets Report: August 2014

Posted September 17th, 2014 by SRECTrade.

The following post is a monthly update outlining the megawatts of solar capacity certified to create SRECs in the Solar REC markets that SRECTrade serves. All PJM data is based on the information available in PJM GATS as of the date noted. All MA data is based on the information provided by the DOER as of the date noted. This analysis does not include projects that are not yet registered and certified with the entities noted herein.

A PDF copy of this table can be found here.

Capacity_August2014

Overview of PJM Eligible Systems Through 9/16/2014

There are 49,360 facilities registered in GATS as of 9/16/2014. See below for a more detailed breakdown.

PV_STH_August2014

There are 290 projects over 1 MW in capacity (up one from July), representing 850.3 MW or 43.8% of the qualified capacity. The largest projects in PJM are concentrated in NJ and MD. There are 37 projects over 5 MW or larger. These make up 18.9% of all qualified capacity in PJM. The top 5 largest projects are listed below.

Top5_August2014

NJ Office of Clean Energy Estimated Installed Capacity Through 8/31/14

On September 18, 2014, the New Jersey Office of Clean Energy (OCE) announced total installed solar capacity reached 1,344.6 MW through 8/31/14; an increase of approximately 7.8 MW over the total capacity reported through the end of July 2014. The average last six month build rate per month, according to the OCE data, is 16.5 MW. Note that this data does not directly tie to GATS registration data because of a lag between NJ Office of Clean Energy certifications and GATS registrations.

Overview of MA DOER SREC-I and SREC-II Eligible Systems

SREC-I Program

The Massachusetts SREC-I program was capped on June 30, 2014, however 90.6 MW of solar is still listed as Qualified but not operational on an update report issued by the DOER on 9/8/2014. In total, 658.5 MW of capacity is listed as currently qualified, of which 567.9 MW of capacity is operational.

SREC-II Program

The SREC-II program opened on April 25, 2014. The program is broken in to Market Sectors. For a detailed overview of the regulations regarding SREC-II please visit here. Overall 134.4 MW of capacity is currently qualified under the SREC-II program, but only 23.2 MW is operational.

How to Interpret The Capacity Table at the Top of this Post

The tables above demonstrate the capacity breakout by state. Note, that for all PJM GATS registered projects, each state includes all projects certified to sell into that state. State RPS programs that allow for systems sited in other states to participate have been broken up by systems sited in-state and out-of-state. Additional detail has been provided to demonstrate the total capacity of systems only certified for one specific state market versus being certified for multiple state markets. For example, PA includes projects only certified to sell into the PA SREC market, broken out by in-state and out-of-state systems, as well as projects that are also certified to sell into PA and Other State markets broken out by in state and out of state systems (i.e. OH, DC, MD, DE, NJ). PA Out-of-State includes systems sited in states with their own state SREC market (i.e. DE) as well as systems sited in states that have no SREC market (i.e. VA). Also, it is important to note that the Current Capacity represents the total megawatts eligible to produce and sell SRECs as of the noted date, while the Estimated Required Capacity – Current and Next Reporting Year represents the estimated number of MW that need to be online on average throughout the reporting period to meet the RPS requirement within each state with only that particular compliance period vintage. For example, New Jersey needed approximately 496.7 MW online for the entire 2013 reporting year to meet the RPS requirement with 2013 vintage SRECs only. SRECs still available from prior eligible periods can also impact the Solar RPS requirements. Additionally, the data presented above does not include projects that are in the pipeline or currently going through the registration process in each state program. This data represents specifically the projects that have been approved for the corresponding state SREC markets as of the dates noted.

Note: SREC requirements for markets without fixed SREC targets have been forecast based on EIA Report “Retail Sales of Electricity by State by Provider” updated 11/8/13. Projected SRECs required utilizes the most recent EIA electricity data applying an average 1.5% growth rate per forecast year. The state’s RPS Solar requirement is then multiplied by forecast total electricity sales to arrive at projected SRECs required. Projected capacity required is based on a factor of 1,200 MWh in PJM states and 1,160 MWh in MA, generated per MW of installed capacity per year.

September 2014 SREC Pricing Update and Auction Results

Posted September 4th, 2014 by SRECTrade.

As of September 4, 2014, below is a summary of indicative pricing across the SREC markets SRECTrade covers (for a PDF copy click here). For September 2014 auction results, scroll down.

9_4_14 pricing

Note: All pricing and notes included are indicative and subject to change. Please contact us for most current markets. If a market is not quoted herein, please contact us directly for further information. 

SRECTrade’s September 2014 SREC Auction closed on 9/3/2014. The clearing prices presented below are representative of transactions executed through the SRECTrade auction. This does not include over the counter spot and forward contract transactions completed through SRECTrade’s brokerage desk. For more information on our brokerage services for corporate clients please click here. Below are the clearing prices by vintage across the SRECs transacted in the auction.

Auction Prices SREC Vintage Year
State 2012 2013 2014 2015
Delaware N/A $55.00 $55.00 N/A
Maryland $120.05 $123.01 $132.00 N/A
Massachusetts SREC-I N/A N/A N/A N/A
New Jersey $150.51 $153.01 N/A $165.00
Ohio Sited N/A N/A N/A N/A
Ohio Adjacent N/A N/A N/A N/A
Pennsylvania N/A $20.05 $25.05 $29.05
Washington, DC N/A N/A $480.00 N/A

The next SRECTrade auction for the PJM SREC markets will close on Thursday, October 2nd, 2014 at 5 p.m. ET.

This document is protected by copyright laws and contains material proprietary to SRECTrade, Inc. It or any components may not be reproduced, republished, distributed, transmitted, displayed, broadcast or otherwise exploited in any manner without the express prior written permission of SRECTrade, Inc. The receipt or possession of this document does not convey any rights to reproduce, disclose, or distribute its contents, or to manufacture, use, or sell anything that it may describe, in whole or in part. If consent to use these materials is granted, a link to the current version of this document on the SRECTrade website must be included for reference.

MA DOER Announces No Capacity to be Allocated to 2016 Managed Growth Sector

Posted August 28th, 2014 by SRECTrade.

On Tuesday, August 26th, the Massachusetts Department of Energy Resources (DOER) announced that pursuant to 225 CMR 14.05(9)(m)1 the 2016 Managed Growth capacity block allocation will be zero (0) MW. The email notice from the DOER can be found here.

The outcome was determined as a result of the DOER’s forecast for expected capacity to be installed under Market Sectors A-C in 2014 through 2016. The analysis prepared by the DOER can be found here. Stakeholders that wish to provide comments on the analysis can do so by emailing DOER.SREC@state.ma.us by 5 p.m. ET on Friday, August 29th.

For further clarification on how projects are categorized by market sector in the SREC-II program please see the following table:

market sectors

Additionally, the DOER provided further guidance on the minimum standard calculations for CY2015 for SREC-I and SREC-II. This email announcement can be found here.

Should any further announcements be made after the comment period, SRECTrade will provide updates on our blog.


August 21, 2014 Massachusetts SREC Market Update Webinar Slides and Recording Available

Posted August 22nd, 2014 by SRECTrade.

On August 21, 2014, SRECTrade hosted a webinar on the MA SREC market. For access to the slides please click here: SRECTrade 8/21/14 MA SREC Update. For access to a video recording of the webinar, click the image below.

Note: For access to the latest net metering information, slide 15 was updated to include a link to the Mass ACA website.

2014_08_21_MA Webinar_thumbnail

SRECTrade Markets Report: July 2014

Posted August 19th, 2014 by SRECTrade.

The following post is a monthly update outlining the megawatts of solar capacity certified to create SRECs in the Solar REC markets that SRECTrade serves. All PJM data is based on the information available in PJM GATS as of the date noted. All MA data is based on the information provided by the DOER as of the date noted. This analysis does not include projects that are not yet registered and certified with the entities noted herein.

A PDF copy of this table can be found here.

Capacity_July2014

Overview of PJM Eligible Systems Through 8/12/2014

There are 47,711 facilities registered in GATS as of 8/12/2014. See below for a more detailed breakdown.

July 2014 Summary

There are 289 projects over 1 MW in capacity (up five from June), representing 840.9 MW or 43.9% of the qualified capacity. The largest projects in the PJM are concentrated in NJ and MD. There are 36 projects over 5 MW or larger. These make up 18.7% of all qualified capacity in the PJM. The top 5 largest projects are listed below.

July 2014 Top 5 Projects

NJ Office of Clean Energy Estimated Installed Capacity Through 7/31/14

On August 13, 2014, the New Jersey Office of Clean Energy (OCE) announced total installed solar capacity reached 1,336.8 MW through 7/31/14; an increase of approximately 17.6 MW over the total capacity reported through the end of June 2014. The average last six month build rate per month, according to the OCE data, is 22.6 MW. Note that this data does not directly tie to GATS registration data because of a lag between NJ Office of Clean Energy certifications and GATS registrations.

Overview of MA DOER SREC-I and SREC-II Eligible Systems

SREC-I Program

The Massachusetts SREC-I program was capped on June 30, 2014, however 110.8 MW of solar is still listed as Qualified but not operational on an update report issued by the DOER on 8/8/2014. In total, 659.1 MW of capacity is listed as currently qualified, of which 548.3 MW of capacity is operational. Note that the total number of SREC-I qualified capacity was revised down by the DOER in the 8/8/2014 report from 660.5 MW to 659.1 MW.

SREC-II Program

The SREC-II program opened on April 25, 2014. The program is broken in to Market Sectors. For a detailed overview of the regulations regarding SREC-II please visit here. Overall 124.0 MW of capacity is currently qualified under the SREC-II program, but only 14.3 MW is operational.

How to Interpret The Capacity Table at the Top of this Post

The tables above demonstrate the capacity breakout by state. Note, that for all PJM GATS registered projects, each state includes all projects certified to sell into that state. State RPS programs that allow for systems sited in other states to participate have been broken up by systems sited in-state and out-of-state. Additional detail has been provided to demonstrate the total capacity of systems only certified for one specific state market versus being certified for multiple state markets. For example, PA includes projects only certified to sell into the PA SREC market, broken out by in-state and out-of-state systems, as well as projects that are also certified to sell into PA and Other State markets broken out by in state and out of state systems (i.e. OH, DC, MD, DE, NJ). PA Out-of-State includes systems sited in states with their own state SREC market (i.e. DE) as well as systems sited in states that have no SREC market (i.e. VA). Also, it is important to note that the Current Capacity represents the total megawatts eligible to produce and sell SRECs as of the noted date, while the Estimated Required Capacity – Current and Next Reporting Year represents the estimated number of MW that need to be online on average throughout the reporting period to meet the RPS requirement within each state with only that particular compliance period vintage. For example, New Jersey needed approximately 496.7 MW online for the entire 2013 reporting year to meet the RPS requirement with 2013 vintage SRECs only. SRECs still available from prior eligible periods can also impact the Solar RPS requirements. Additionally, the data presented above does not include projects that are in the pipeline or currently going through the registration process in each state program. This data represents specifically the projects that have been approved for the corresponding state SREC markets as of the dates noted.

Note: SREC requirements for markets without fixed SREC targets have been forecast based on EIA Report “Retail Sales of Electricity by State by Provider” updated 11/8/13. Projected SRECs required utilizes the most recent EIA electricity data applying an average 1.5% growth rate per forecast year. The state’s RPS Solar requirement is then multiplied by forecast total electricity sales to arrive at projected SRECs required. Projected capacity required is based on a factor of 1,200 MWh in PJM states and 1,160 MWh in MA, generated per MW of installed capacity per year.

Massachusetts Market Update Webinar – August 21st at 2 pm ET

Posted August 14th, 2014 by SRECTrade.

SRECTrade will host a webinar on Thursday, August 21st at 2 pm ET to review the Massachusetts SREC market.

The last several months in Massachusetts have been dynamic. The Massachusetts SREC-II program started on April 25, 2014. Also, sweeping legislation was proposed that would have fundamentally changed the Massachusetts solar  industry.

Items to be covered in Thursday’s webinar:

  • SREC-I and SREC-II market pricing and supply
  • The 3rd round successful outcome of the MA2013 SREC-I Solar Credit Clearinghouse Auction
  • Overview of the rise and fall of H.4185 (An act relative to net metering)
  • Next steps for net metering (and SREC policy) development in Massachusetts

Register for the webinar here.