
After the recent move lower in Maryland spot SREC prices, we decided to refresh our capacity models and market projections with the latest data available from PJM GATS. You can find our updated presentation here.
The Maryland SREC market remains significantly oversupplied after a record breaking 2016. Through the 2016 calendar year the Maryland solar market installed an average of 23MW/month for a grand total of 278MW over the course of the year. Comparatively, in CY 2015 the monthly build rate was just under 14MW/month for a total of 164MW. That 70% increase in installed capacity had a pronounced impact on market pricing for MD SRECs, with MD16 SRECs declining in value from $150 in late 2015 to $20 in late 2016. In recent weeks, as the market continued to digest the true scale of oversupply, the price for spot MD SRECs has declined to between $10 and $15.
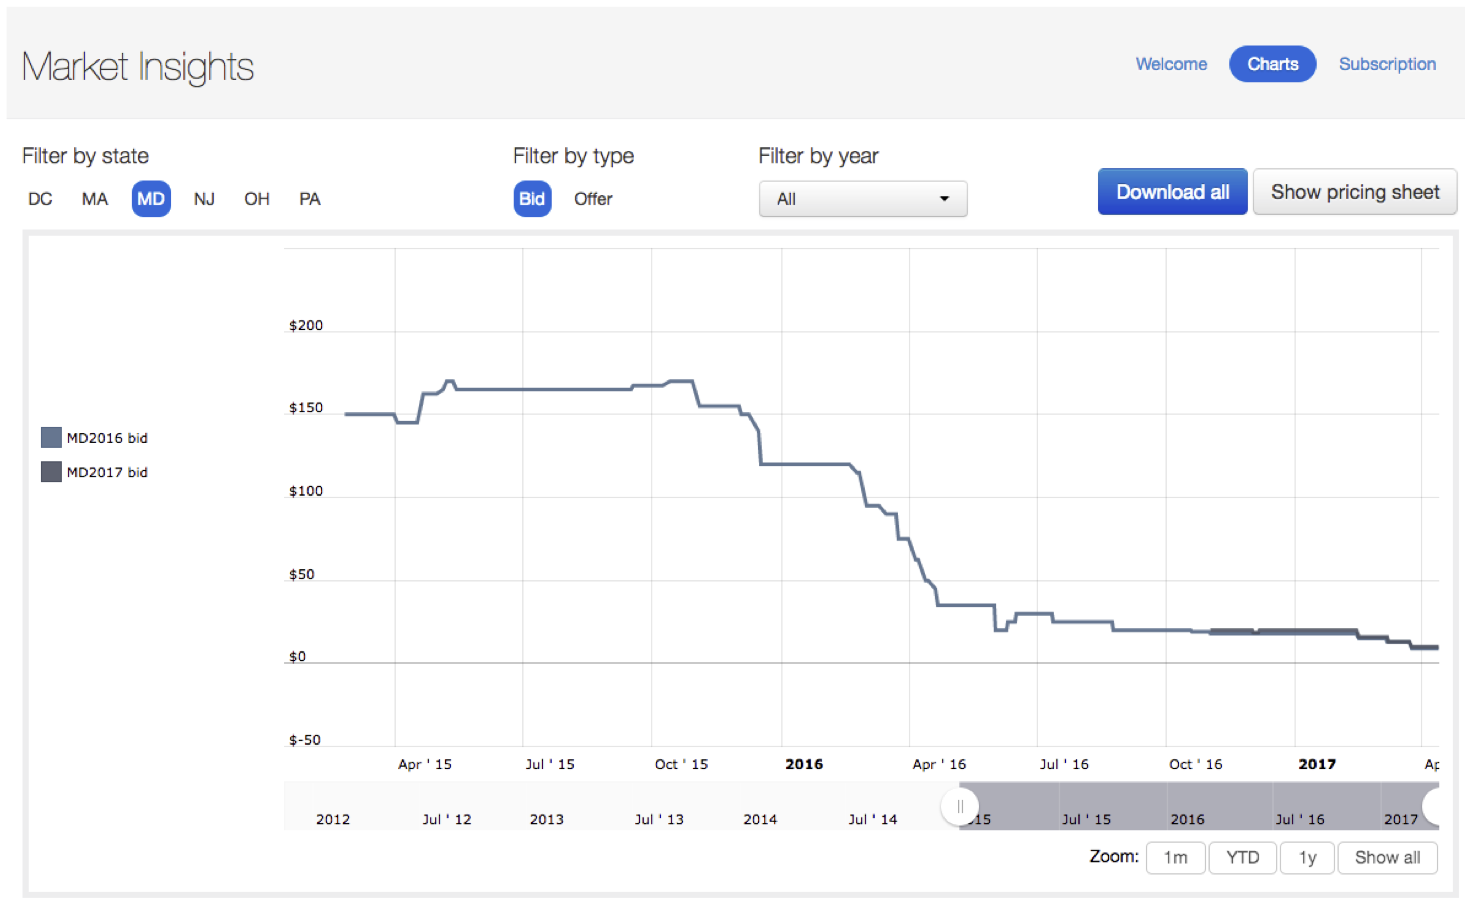
Source: SRECTrade Market Insights
Turning our focus to calendar year 2017, the current market is still reflective of the significant supply of SRECs generated in previous years which is still eligible to be brought to market for 2017 compliance obligations. The available supply of MD15 and MD16 SRECs is just shy of 400,000 SRECs, representing a full 56% of the 2017 SREC compliance obligation. An additional 70,000 SRECs were issued through Q1 of 2017, and using the current trailing twelve month average (TTM) build rate in MD, we project that another 730,722 SRECs will be produced over the balance of the 2017 calendar year.

This adds up to a 2017 oversupply of roughly 490,700 SRECs, or 69% of the 2017 compliance obligation. One important point to consider, however, is the sustainability of the current 17.5MW/month TTM build rate in the current SREC environment. We have seen a marked deceleration in the addition of new capacity as many projects – mostly those who would receive the wholesale rate of power as opposed to the retail rate – no longer pencil economically with $10 to $20 SRECs. Given this reality, we chose to present our projections below with the current TTM representing the “bull case” for future build, while significantly lower monthly capacity additions of 8.8MW/month and 13.1MW/month make up the bear and base cases, respectively.

As we can see by looking out along the timeline, the expected slow down in build will result in the market eventually rebalancing itself, with supply beginning to match demand in 2020. However, even in this “best case” scenario, the Maryland market will still be a difficult place for developers unable to source PPAs with robust power pricing to successfully build new solar assets. The persistent oversupply will continue to keep SREC pricing depressed through the short to medium term. However, hope is not lost entirely. This trend could quickly be reversed by any sustained effort to support and pass an expanded RPS schedule with more aggressive percentage targets for solar’s share of the state energy mix. Expect markets to quickly turn should a viable legislative plan be proposed and adopted over the coming months or years.
As always, we will continue to monitor the state of the Maryland SREC market and offer our opinions when we believe they will be useful. Feel free to reach out to the SRECTrade brokerage team to request the data used to build our models or to inquire about our projections for the Maryland SREC market. Additionally, feel free to consult the Markets section of our webpage for quick facts regarding the current RPS framework and specifics about the SREC program.
Disclaimer. This document, data, and/or any of its components (collectively, the “Materials”) are for informational purposes only. The Materials are not intended as investment, tax, legal, or financial advice, or as an offer or solicitation for the purpose or sale of any financial instrument. SRECTrade, Inc. does not warranty or guarantee the market data or other information included herein, as to its completeness, accuracy, or fitness for a particular purpose, express or implied, and such market data and information are subject to change without notice. Past performance should not be taken as an indication or guarantee of future performance, and no representation or warranty, express or implied, is made regarding future performance. Any comments or statements made herein do not necessarily reflect those of SRECTrade, Inc. SRECTrade, Inc. may have issued, and may in the future issue, other communications, data, or reports that are inconsistent with, and reach different conclusions from, the information presented herein.
Copyright. This document is protected by copyright laws and contains material proprietary to SRECTrade, Inc. This document, data, and/or any of its components (collectively, the “Materials”) may not be reproduced, republished, distributed, transmitted, displayed, broadcasted or otherwise disseminated or exploited in any manner without the express prior written permission of SRECTrade, Inc. The receipt or possession of the Materials does not convey any rights to reproduce, disclose, or distribute its contents, or to manufacture, use, or sell anything that it may describe, in whole or in part. If consent to use the Materials is granted, reference and sourcing must be attributed to the Materials and to SRECTrade, Inc. If you have questions about the use or reproduction of the Materials, please contact SRECTrade, Inc.
Tweet