Archive for the ‘SREC Markets’ Category

MA SREC-II Extension Webinar

Posted December 13th, 2016 by SRECTrade.

Earlier today, SRECTrade hosted a webinar covering the current state of the Massachusetts SREC-II program, key deadlines for qualifying systems under SREC-II, and SRECTrade application processes.

The application window is currently open for all MA systems, regardless of size, although qualification deadlines are approaching. Please feel free to reference SREC-II Extension Application Instructions HERE.

For access to the presentation slides, please click here: MA SREC-II Extension Webinar. To view a video recording of the webinar, please click the image below.

This document and recording is protected by copyright laws and contains material proprietary to SRECTrade, Inc. It or any components may not be reproduced, republished, distributed, transmitted, displayed, broadcast or otherwise exploited in any manner without the express prior written permission of SRECTrade, Inc. The receipt or possession of this document does not convey any rights to reproduce, disclose, or distribute its contents, or to manufacture, use, or sell anything that it may describe, in whole or in part. If consent to use these materials is granted, a link to the current version of this document on the SRECTrade website must be included for reference.

MA SREC-II Installer Webinar

Posted December 12th, 2016 by SRECTrade.

SRECTrade will be hosting a webinar this Tuesday, December 13th, at 2:00 PM EST. The webinar will cover the current state of the Massachusetts SREC-II program, key deadlines for qualifying systems under SREC-II, and SRECTrade application processes to consider as the program’s close approaches.

To attend the webinar click HERE to register. A recording will be made available on SRECTrade’s blog for those unable to attend.

Illinois Passes New RPS, Comprehensive Energy Package

Posted December 2nd, 2016 by SRECTrade.

Following a whirlwind revival and numerous amendments, both chambers of the Illinois General Assembly voted late on Thursday to pass a comprehensive energy bill to address the state’s RPS, energy efficiency programs, net metering, nuclear plants, and more. SB 2814, the Future Energy Jobs Bill, is a product of nearly two years of negotiations between utilities, renewable energy stakeholders, environmental advocates, ratepayer advocates, and others. The 440-plus page bill underwent nearly 30 rounds of changes before passing 63-38 in the House and 32-18 in the Senate on the final day of the General Assembly’s veto session.

The energy package includes a sizable bail-out for Exelon’s struggling nuclear power plants–providing $235 million a year to Exelon for 13 years to keep the plants up and running. In return, the adjustment will allow Exelon’s utility subsidiary, Commonwealth Edison (ComEd) to spend roughly $400 million a year on energy efficiency programs. Costs to consumers will be capped at 1.3% over 2015 rates for business classes, and at 25 cents per month for ComEd’s residential customers.

In addition to the nuclear bail-out and energy efficiency programs, the Future Energy Jobs Bill will reform the state’s RPS policy. While Illinois’ RPS target will remain at 25% by 2025, the bill provides for new community solar, low-income, and brownfield solar targets. Distributed generation (DG) will be incentivized through an adjustable block incentive program, which will allow DG facilities to receive upfront REC payments in a 15-year contract with the Illinois Power Agency.

Thanks to the advocacy of the solar industry, ComEd’s proposed demand charge was eliminated from the final version of the bill, and retail net metering rates will be preserved with grandfathering up to a 5% statutory cap. Once the cap is hit, net metering rates will be replaced through a commission process to establish fair DG compensation based on locational grid value.

Governor Bruce Rauner (R) has already announced his support of the heavily negotiated bill. After Gov. Rauner signs the bill, it will take effect on June 1, 2017.

SRECTrade at Solar Focus 2016: Maryland SREC Update and Pennsylvania RPS Overview

Posted November 21st, 2016 by SRECTrade.

Last week, members of the SRECTrade team attended MDV-SEIA’s Solar Focus Conference in Washington, D.C.  The conference’s focus was on “cracking the code for East Coast solar”, and the subject matter covered a wide variety of issues relevant to the solar industry across the Mid-Atlantic region.  In particular, the conference provided a forum for in-depth conversations around the future of critical, although challenged, state markets such as Pennsylvania and Maryland.

SRECTrade’s Director of Environmental Markets, Brett Waikart and our Director of Regulatory Affairs and General Counsel, Allyson Browne were invited to speak about the Maryland and Pennsylvania markets, respectively.  Brett’s presentation covered the fundamentals of the Maryland SREC market and laid out hypothetical future scenarios assuming various RPS carve-out schedules and build rates.  Allyson’s presentation focused on the composition of Pennsylvania’s electricity market and emphasized different aspects of the state’s Alternative Energy Portfolio Standard (AEPS) structure that could be adjusted in order to improve market conditions.  Their presentations are included below, along with a brief synopsis of the analysis provided.

Maryland SREC Update – November 2016

Little has changed in the overall degree of oversupply in the Maryland spot market since our last post in September. There have been no changes to official RPS policy, and supply continues to far outstrip the demand levels set by the RPS compliance schedule.  As can be seen in the snapshot below, as of November 15th there were approximately 156k CY14 and CY15 SRECs still available for sale and another 477k CY16 SRECs that had been generated in the current year.  Assuming that recent build rates continue through the end of 2016, we anticipate another 89k SRECs to be generated before the year is over.  When compared to the MD16 RPS obligation of  approximately 431k SRECs, these numbers indicate that we are oversupplied by a little more than 291k SRECs, or 68% of the current RPS demand requirement. MD16 snapshot

While this degree of oversupply is substantial, the monthly build rate numbers confirm that weaker project economics, caused by depressed SREC prices, have indeed slowed the installation of new capacity significantly.  The average amount of new capacity added over the last three months has slowed to just less than 10MW/month, as compared to just less than 30MW/month in the first quarter of 2016.  Also notable is that we have not seen the installation of a single asset greater than 1MW in capacity reports since June.  You can clearly see the trend lower in the graph below, which illustrates the quarterly sum of new capacity brought online over the last year.

Q4_15 to Q3_16

With the MD SREC market now fully reflecting the current degree of oversupply, and the effects now being felt by the asset development industry, stakeholders can agree that the time has come to find a solution.  The Maryland market has now fully outgrown the trajectory previously laid out for it through the current RPS schedule.  With that in mind, we now present a third scenario in our MD Capacity Presentation.  In addition to our typical supply and demand projections under the current RPS and the RPS proposed through HB1106, we now include an analysis illustrating the potential market conditions that would result from a more aggressive RPS schedule.  You will find our results in the slide deck provided below.

Our full capacity presentation can be found here.

Pennsylvania Policy Update

The concept of oversupply is even more familiar to Pennsylvania’s SREC market. Although the state’s AEPS targets exceed those of other PJM state RPS targets on an absolute basis, the state has been fundamentally oversupplied for years due to the design of its program.

In her presentation, Allyson takes a holistic look at Pennsylvania’s electricity market and generation mix and applies this foundation to the state’s AEPS design. The result is a structural oversupply that will require several supply- and demand-side adjustments before the market will be able to rebound and achieve supply-demand balance.

After providing this framework for the panel’s discussion, Allyson addresses Pennsylvania’s work towards compliance with the EPA’s Clean Power Plan (despite its now uncertain future) and identifies possible routes for reinvigorating Pennsylvania’s solar market.

Allyson’s full presentation can be viewed here.


As always, please feel free to reach out to your coverage on the SRECTrade brokerage desk to discuss any observations or comments you may have regarding our analysis or your view of the SREC markets.  We will continue to update our analysis and provide you with any new information we receive as it becomes relevant.


Disclaimer. This document, data, and/or any of its components (collectively, the “Materials”) are for informational purposes only. The Materials are not intended as investment, tax, legal, or financial advice, or as an offer or solicitation for the purpose or sale of any financial instrument. SRECTrade, Inc. does not warranty or guarantee the market data or other information included herein, as to its completeness, accuracy, or fitness for a particular purpose, express or implied, and such market data and information are subject to change without notice. Past performance should not be taken as an indication or guarantee of future performance, and no representation or warranty, express or implied, is made regarding future performance. Any comments or statements made herein do not necessarily reflect those of SRECTrade, Inc. SRECTrade, Inc. may have issued, and may in the future issue, other communications, data, or reports that are inconsistent with, and reach different conclusions from, the information presented herein.

Copyright. This document is protected by copyright laws and contains material proprietary to SRECTrade, Inc. This document, data, and/or any of its components (collectively, the “Materials”) may not be reproduced, republished, distributed, transmitted, displayed, broadcasted or otherwise disseminated or exploited in any manner without the express prior written permission of SRECTrade, Inc. The receipt or possession of the Materials does not convey any rights to reproduce, disclose, or distribute its contents, or to manufacture, use, or sell anything that it may describe, in whole or in part. If consent to use the Materials is granted, reference and sourcing must be attributed to the Materials and to SRECTrade, Inc. If you have questions about the use or reproduction of the Materials, please contact SRECTrade, Inc.

Massachusetts DOER Updates Exempt Load Figures

Posted November 16th, 2016 by SRECTrade.

On November 14, the DOER updated the exempt load projections for both SREC-I and SREC-II, as well as provided information on the total volume of re-minted SRECs available in the market. These two data points impact the level of demand and expected supply, respectively.

Briefly on SREC-II, the exempt load numbers for 2016 and 2017 increased slightly, which will in turn lower aggregate demand. We already anticipated those markets being oversupplied and with this new data, this assumption strengthens. See our most recent analysis for a deeper dive.

As a follow-up to our recent post on the MA16 SREC-I market, we will incorporate recent data published by the Department of Energy Resources (DOER) and re-examine supply assumptions to provide another view into the recent weakness in the market.

Starting with the demand side of the market, we now project the total market demand for MA16 SREC-I in the range of 807,203 – 832,507, depending on the total amount of electricity sales. Note, the scenario on the left assumes load is down approximately 3% from 2015, while the scenario on the right keeps load flat at the estimated 2015 levels.

2016_11_04_SREC-I_Model

For a more nuanced view on the projected supply for the year, we consider using Q3 and Q4 issued SRECs from 2015 as a proxy for this year. Adding those figures to SRECs already issued in Q1 and Q2 of this year results in an estimated supply of 818,761 for MA16 SREC-I.

With the latest data from DOER, we can now add 50,499 additional SRECs to the supply side. These SRECs are re-minted volumes from past Clearinghouse Auctions that are eligible for compliance on 2016. In sum, we anticipate a total supply of 869,260.

When compared to the range of demand we anticipate the market is long by 4%-8% of demand, or 36,753-62,057 SRECs:

2016_11_04_SREC-I_Model

Factors that could swing the market one way or the other include how much electricity is sold and how much output comes from the installed capacity. Additionally, although the market is potentially oversupplied, it is possible some participants may not bring supply to the market if market prices are lower than their expectations. This could influence price upward to levels we experienced earlier in the year. On the other side, if natural buy-side demand chooses to take a wait and see approach the efficiency of the market can be impacted and influence price downward. The latter has been the case over the past months as the market has moved down on a dearth of natural buy-side demand.

Clean Energy Advocates Urge Gov. Kasich & Ohio Lawmakers to Reinstate Frozen RPS

Posted November 3rd, 2016 by SRECTrade.

Two years ago, Ohio took a gamble with the state’s renewable energy industry by imposing a two-year freeze on Ohio’s energy efficiency (EERS) and Renewable Portfolio Standard (RPS). With the freeze due to expire at the end of the year, state lawmakers are evaluating potential paths for lifting the freeze, including opposing options to either bolster the RPS moving forward or convert the RPS to a voluntary program. As state lawmakers look to vote on proposals shortly after the November 8th General Election, nine companies have stood up in support of reinstating–and strengthening–Ohio’s energy efficiency and RPS, alongside the state’s many clean energy advocates.

It is clear to many that the RPS freeze was a failed experiment for Ohio. The RPS has provided many benefits to Ohio residents, including the creation of thousands of new clean energy jobs and the infusion of more than $160 million in annual GDP from the clean energy sector. During the freeze, however, utility companies reduced–or in some cases completely suspended–renewable energy and energy efficiency programs and services. Clean energy companies had no choice but to leave Ohio. As a result, Ohio’s wind industry lost more than 1,400 jobs in 2015 alone. Today, Ohio’s projected growth for clean jobs is only at 4.9%. In order to get back on track, the industry needs a jolt of support that can only come from the reinstatement of the RPS and EERS.

In an effort to show solidarity with the clean energy industry, nine companies teamed up behind sustainability advocate Ceres Inc., encouraging lawmakers to consider more–not less–aggressive RPS and EERS policies. The companies, including giants such as Campbell Soup, Clif Bar, Gap, Nestle, and Whirlpool, collectively employ more than 25,000 people in Ohio. Each company issued individual statements in support of the coalition’s request.

Gap Inc.’s Director, Environmental Impact, Christina Nicholson urged lawmakers to act. “The time to act is now. We urge leaders in Ohio to lift the freeze on the state’s renewable energy and energy efficiency standards. Clean energy policies are smart and will build a stronger and more resilient Ohio. As a company with a large presence in the state, energy efficiency and renewable energy is important to our business and our future. We’ve set an ambitious goal to reduce our GHG emissions by 50% by 2020, and we encourage Ohio’s leaders to help us all move toward a clean energy future.”

Other groups, including Ohio Citizen Action, are also actively advocating for stronger environmental standards. The group is hosting a Climate Action Rally and Press Conference on November 16th to encourage Governor Kasich to take a stand against those trying to skirt or otherwise weaken the reinstatement of the RPS. Earlier this year, while seeking the Republication nomination for President, Gov. Kasich told a New Hampshire crowd that he would reinstate the RPS if the legislature attempted to gut the policies, even though he considered the original RPS to be “unpalatable”. Given the legislature’s current position on the issue, all eyes are on Gov. Kasich to see whether he sticks to his campaign words from January and pressures the Legislature to reinstate the RPS and EERS without further delay.

MA16 SREC-I Market Review

Posted November 3rd, 2016 by SRECTrade.

With the October issuance of Q2 2016 SRECs behind us, we are now approximately halfway through the 2016 energy year in Massachusetts. This blog post will take into account observed issuance numbers from the first half of the year and use projections for future issuance periods to understand what caused the fall in MA16 SREC-I prices from $450+ in January to more recent bids of $380. We will look at the supply and demand balance in order to survey what may be coming in the months ahead.

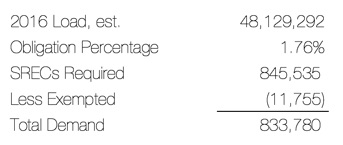
Recall that demand is driven by retail electric sales in the State. The latest data we have comes from 2014, a year in which 48,129,294 MWh were sold. If we assume that retail electricity sales are flat and we apply the obligation of 1.76% and then adjust for exempted load, we derive a total estimated demand of 833,780 SRECs:
MA16 SREC-I Demand

On the supply side of the market, the simplest analysis assumes the market generates nearly 784,000 SRECs and when combined with the re-minted volumes from this year’s SCCA (1,898), then we get a total supply of 785,886. When compared to the demand outlined above, we conclude the market is short nearly 48,000 SRECs.

MA16 REC-I simple supply

What would explain falling prices in a market that is potentially under-supplied? The quick answer is that perhaps retail sales of electricity are falling instead of flat, which would lower the demand. Alternatively, perhaps the supply of SRECs is higher than detailed. We’ll examine some supply scenarios first.

One component of supply is the banked SRECs from prior years. Retail suppliers can bank up to 10% of their annual obligation for use in future years. The maximum volume of banked RECs in the market is estimated at 65,382 – the sum of the total obligation in 2014 and 2015 multiplied by 10%. If all of those SRECs were brought to market in 2016, then we would see the market long by 17,488 SRECs. We see that scenario as unlikely since 2015 was short and the bank may have been used to avoid paying Alternative Compliance Payments (ACPs). On the other hand, it’s possible that between re-minted SRECs from the 2013 and 2014 SCCCA and banked volumes, that upwards of 15,000 SRECs from prior vintages may impact the 2016 market. This source of supply would help to tighten the balance of supply and demand, but not necessarily push to over-supply.

Examining a different scenario on the demand side, even if retail sales were down 3%, the total SREC demand would still sit at 808,414, leaving a tight, yet still under-supplied market based on the simpler supply analysis.

Another element worth mentioning is liquidity. While a healthy market needs liquidity from both buyers and sellers in order to function properly, we will direct our attention to the buy-side. Because there are far more sellers than buyers in this market, an absence of even a handful of buyers is far more impactful to the efficiency of the SREC markets than the absence of an equivalent number of sellers.

In recent months we have observed a noticeably subdued level of activity from buyers. What happens when SRECs are issued and a bunch of sellers come into a quiet market? As evidenced from pricing over the last month, bids start to retreat:

Market_Insights___SRECTrade

A simplistic read of the current state of the market is that prices have dropped due to the possibility of oversupply. However, deeper examination of current supply and demand in SREC-I markets points towards a tighter, more balanced market. The bearish sentiment reflected in recent weeks may actually reflect a lack of activity from natural compliance buyers in the face of a glut of supply coming to market after Q2 issuance. These two scenarios mean very different things for medium to long term “equilibrium” pricing in the SREC-I market. A structural and persistent oversupply, a scenario we do not perceive as likely, would mean that lower prices are justified and here to stay. A mismatch of liquidity due to trading preferences of buyers and sellers however would point towards short term volatility but longer term stability in supportive SREC prices.

As always, we will continue to provide follow-up analysis as more information becomes available.  Feel free to reach out to your contacts on SRECTrade’s brokerage desk with any questions you may have.


Disclaimer. This document, data, and/or any of its components (collectively, the “Materials”) are for informational purposes only. The Materials are not intended as investment, tax, legal, or financial advice, or as an offer or solicitation for the purpose or sale of any financial instrument. SRECTrade, Inc. does not warranty or guarantee the market data or other information included herein, as to its completeness, accuracy, or fitness for a particular purpose, express or implied, and such market data and information are subject to change without notice. Past performance should not be taken as an indication or guarantee of future performance, and no representation or warranty, express or implied, is made regarding future performance. Any comments or statements made herein do not necessarily reflect those of SRECTrade, Inc. SRECTrade, Inc. may have issued, and may in the future issue, other communications, data, or reports that are inconsistent with, and reach different conclusions from, the information presented herein.

Copyright. This document is protected by copyright laws and contains material proprietary to SRECTrade, Inc. This document, data, and/or any of its components (collectively, the “Materials”) may not be reproduced, republished, distributed, transmitted, displayed, broadcasted or otherwise disseminated or exploited in any manner without the express prior written permission of SRECTrade, Inc. The receipt or possession of the Materials does not convey any rights to reproduce, disclose, or distribute its contents, or to manufacture, use, or sell anything that it may describe, in whole or in part. If consent to use the Materials is granted, reference and sourcing must be attributed to the Materials and to SRECTrade, Inc. If you have questions about the use or reproduction of the Materials, please contact SRECTrade, Inc.

MA DOER Seeking Comments on Next Generation Solar Incentive Straw Proposal

Posted October 25th, 2016 by SRECTrade.

On September 23, 2016, the Massachusetts Department of Energy Resources (DOER) presented its Straw Proposal to outline its vision for the next solar incentive program for the state. The DOER is proposing to shift away from the state’s successful SREC program, which has created one of the largest and most robust solar markets in the country.

Under the DOER’s proposal, a declining block feed-in-tariff would be established in regulated utility territories, and a separate program would be created for municipal light districts. Moving away from the current market-based framework will impose a substantial transition burden and introduce new costs to participants. The shift to a completely different program will have a negative impact on the viability of the solar industry in the interim and poses uncertainty moving forward.

Massachusetts has installed more than 1,200 MW of operational solar capacity to date and was ranked 2nd in the nation in total solar industry employment in 2015. Replacing the current market-based framework with a declining block feed-in-tariff will not only be costly to all stakeholders, but it will also fail to satisfy the DOER’s objective to “provide clear policy mechanisms that control ratepayer costs and exposures”. By imposing this new and complicated model, the DOER will force the state’s many market participants to manage, understand, and abide by multiple programs at once. This will undoubtedly increase soft costs and increase administrative burden across the industry.

In contrast, establishing an SREC-III program would allow the state’s solar industry to continue relying on a market-based policy to set incentive levels and forge ahead on its path to a stable, equitable, and self-sustaining solar market. By making adjustments to SREC factors, market sectors, the SCCA and SACP, the Commonwealth can continue to benefit from the successful SREC model and preserve the progress it has made since SREC-I was implemented six years ago.

SRECTrade encourages all stakeholders in the Massachusetts solar market to submit comments in support of a smooth transition to another successful SREC program. Comments can be submitted to the DOER via email at DOER.SREC@state.ma.us and must be submitted by this Friday, October 28th.

New Jersey SREC Update – October 2016

Posted October 11th, 2016 by SRECTrade.

New Jersey has continued to be the most active SREC market both in terms of volume and price action, with the market experiencing a small sell-off in recent days.  We maintain that this activity is not necessarily indicative of the true fundamental balance of the market, but rather due to selling pressure from a small group of market participants.  In order to provide a more objective perspective on the state of the New Jersey solar market we have updated our capacity presentation, available here.

As of August 31, 2016 there were 1,871.9MW of solar capacity online and generating SRECs in the state of New Jersey.  This was up 20.5MW from the New Jersey BPU solar installation report for July 2016, and up 78MW from our last NJ update after the solar installation report for June 2016.

After the June report, we emphasized that the headline number reported in the BPU’s solar installation reports can be slightly misleading if taken solely at face value.  A deeper dive into what exactly contributed to the increase from the last report provides additional insight into the true state of the New Jersey market.  The 20.5MW increase from the July 2016 report combines the following:

  • 1.5MW increase for upward revisions in 2011-2014 monthly figures
  • 1.6MW increase for upward revisions in 2015 monthly figures
  • 11.3MW increase for upward revisions in 2016 monthly figure for January-June
  • 5.5MW increase for upward revisions in July 2016, bringing the monthly build from 7MW to 12.5MW
  • 10.9MW addition for new build in August 2016
  • 10.2MW decrease for downward revisions in “estimated installations” (essentially the BPU pipeline figure for old PTO applications that have not yet been processed)


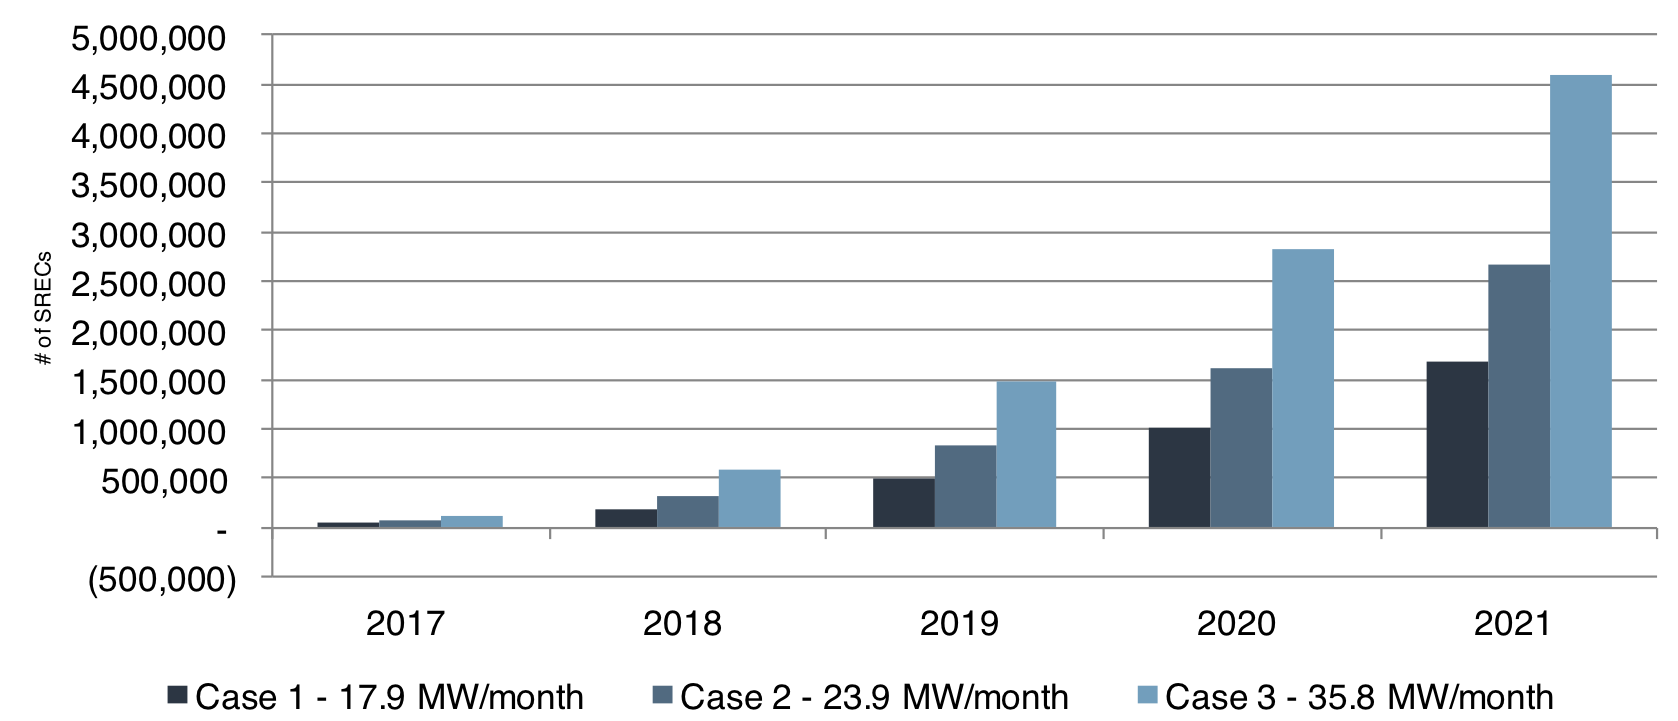
This breakdown helps illustrate a few important trends.  First, the magnitude of these revisions has decreased sharply from previous reports, indicating that the BPU may have begun to catch up on the back-dated PTO applications that have served to inflate the headline month-on-month change in reported capacity since Applied Energy Group took over reporting in May of this year.  Second, the rate at which new capacity is being built and brought online has slowed markedly since the peak we witnessed in the first half of this year.  The average build rate for December 2015 through May 2016 was an impressive 33MW/month, however we believe the current last twelve month (LTM) average of 23.9MW/month is a closer representation of the sustainable long term trend.  That LTM is what we use as the base case (Case 2 below) for our resulting scenario analysis and future projections.

In the graph below you’ll find the representation of our projection analysis. Under the current RPS schedule and using the observed LTM build rate as our base case (i.e. Case 2), we see 2017 as slightly over supplied.  The market balance continues into a slight oversupply in 2018, with the degree of oversupply steadily increasing year-on-year through 2021.  All data and projections are available in our presentation hyperlinked above.


New Jersey SREC S&D


As always, we will continue to monitor the development of the market trends mentioned above and share our analysis as new information becomes available.  In the meantime please feel free to reach out to your SRECTrade coverage with any questions or comments.


Disclaimer. This document, data, and/or any of its components (collectively, the “Materials”) are for informational purposes only. The Materials are not intended as investment, tax, legal, or financial advice, or as an offer or solicitation for the purpose or sale of any financial instrument. SRECTrade, Inc. does not warranty or guarantee the market data or other information included herein, as to its completeness, accuracy, or fitness for a particular purpose, express or implied, and such market data and information are subject to change without notice. Past performance should not be taken as an indication or guarantee of future performance, and no representation or warranty, express or implied, is made regarding future performance. Any comments or statements made herein do not necessarily reflect those of SRECTrade, Inc. SRECTrade, Inc. may have issued, and may in the future issue, other communications, data, or reports that are inconsistent with, and reach different conclusions from, the information presented herein.

Copyright. This document is protected by copyright laws and contains material proprietary to SRECTrade, Inc. This document, data, and/or any of its components (collectively, the “Materials”) may not be reproduced, republished, distributed, transmitted, displayed, broadcasted or otherwise disseminated or exploited in any manner without the express prior written permission of SRECTrade, Inc. The receipt or possession of the Materials does not convey any rights to reproduce, disclose, or distribute its contents, or to manufacture, use, or sell anything that it may describe, in whole or in part. If consent to use the Materials is granted, reference and sourcing must be attributed to the Materials and to SRECTrade, Inc. If you have questions about the use or reproduction of the Materials, please contact SRECTrade, Inc.

PJM GATS Solar – Registered Capacity Update as of September 2016

Posted September 29th, 2016 by SRECTrade.

The following post is a monthly update outlining the megawatts of solar capacity certified to create SRECs in the PJM GATS solar REC markets that SRECTrade serves. All data is based on the information available in PJM GATS as of the date noted.

PJM CapacityHelv

The chart above compares the megawatts (MWs) registered in PJM GATS as of September 23, 2016 (the blue bar) to the estimated RPS solar MWs needed to be operational, through the duration of the current reporting year, to meet each market’s RPS targets (the green bar). Note that the Estimated RPS MWs quantity does not take into consideration SRECs eligible from previous reporting years and is only used as an estimate relative to the current MWs registered in PJM GATS. All actual RPS requirements are represented in megawatt hours (i.e. SRECs) required per year. The installed capacity operational over that time will produce SRECs, in addition to any eligible SRECs from previous periods, to end up with the final supply relative to that reporting year’s demand. For estimates on required number of SRECs per reporting year across the SREC markets SRECTrade covers, please visit our state market summary pages.

As of August 31st, New Jersey had installed a cumulative total of 1,871.9MW of nameplate capacity, 139.7MW of which had been installed since the Applied Energy Group’s May 31st report (June-August).  Their Solar Installation Report and Solar Pipeline Report can be found online here on the New Jersey Office of Clean Energy website, and our most recent analysis of those numbers can be found here. Please note that this analysis includes 15.6MW of estimated installations (final “as-built” applications submitted, but not yet processed).

Additionally, please note the following in the figures presented above:

OH2016: Represents all OH eligible solar facilities and includes some facilities that are cross-registered in PA. If any systems were eligible in higher priced markets, such as DC, the capacity was excluded from OH eligibility as it could be sold at a higher price in DC.

DE2016: Represents all solar facilities eligible for the DE solar RPS requirement. Some facilities registered in DE are also eligible in PA and could impact that market’s supply.

DC2016: Includes all systems eligible for the DC SREC market. If a system was eligible in another market, it was not included there given the current pricing for DC SRECs.

PA2017: Represents all solar facilities eligible for the PA SREC market. Some systems are cross-registered in OH as well. If a system was eligible in any higher priced markets (i.e. NJ or MD sited systems that cross-registered in PA) they were not included in the total MW balance displayed above.

MD2016: Includes all MD eligible solar capacity registered in PJM GATS as of the date noted. If projects were cross-registered in Washington D.C., the capacity was not allocated to Maryland’s eligible MW total.

NJ2017: The balance noted above represents the 8/31/16 Solar Installation Report reported by Applied Energy Group.

PJM GATS Registered Solar Projects Summary

There are 101,215 facilities across 3,430MW registered in PJM GATS as of 9/23/2016.

432 projects are 1MW or larger in capacity, representing 1763.9MW or 51.4% of the qualified capacity. There are 101 projects that are 5MW or larger. These make up 32.7% of all qualified capacity, 1,122.1MW total, in PJM GATS.

Note: SREC requirements for markets without fixed SREC targets have been forecast based on the EIA Report “Retail Sales of Electricity by State by Provider”. Projected SRECs required utilizes the most recent EIA electricity data applying an average 1.0% growth rate per forecast year. The state’s RPS Solar requirement is then multiplied by forecast total electricity sales to arrive at projected SRECs required. Projected capacity required is based on a factor of 1,200MWh, in PJM GATS states, generated per MW of installed capacity per year.