Archive for the ‘SREC Markets’ Category

MA SREC-I Update: 2016 Demand and 2014 SCCA Clears Round 1

Posted July 28th, 2015 by SRECTrade.

Over the past couple days, the Massachusetts Department of Energy Resources (DOER) has released a couple important announcements.

MA2016 SREC-I Compliance Obligation

Yesterday, July 27, 2015, the DOER released the 2016 SREC-I preliminary compliance obligation. The details of the email can be found here.

The preliminary obligation for the 2016 compliance year has been set at 845,519 SRECs. The MA DOER noted that the requirement will be finalized and announced no later than August 30, 2015. Additionally, it was stated that the requirement, “will more than likely lead to an undersupply of the SREC-I market in 2016”. The DOER also specifically noted that the undersupply for MA2016 SREC-Is has no impact on the MA SREC-II market.

For more information on the calculation of the MA2016 SREC-I requirement visit the DOER website and the detailed calculation document.

Solar Credit Clearinghouse Auction Clears in Round 1

Today, July 28, 2015, the DOER announced the results of the Solar Credit Clearinghouse Auction (SCCA) for MA2014 SREC-I vintage Solar Renewable Energy Credits. Available for sale were 124,831 MA2014 SREC-Is at a fixed price of $300/SREC to all buyers; a price of $285/SREC to sellers. The auction hosted 55 unique bidders with a total bid volume of 1,113,789 SRECs, almost 9.0x the amount of SRECs available for sale. More information about the SCCA can be found on the DOER’s website.

SRECTrade Markets Report: June 2015

Posted July 27th, 2015 by SRECTrade.

The following post is a monthly update outlining the megawatts of solar capacity certified to create SRECs in the Solar REC markets that SRECTrade serves. All PJM data is based on the information available in PJM GATS as of the date noted. All MA data is based on the information provided by the DOER as of the date noted. This analysis does not include projects that are not yet registered and certified with the entities noted herein.

A PDF copy of this table can be found here.

Capacity_June2015

Overview of PJM Eligible Systems Through 7/2/2015

There are 63,447 facilities registered in GATS as of 7/2/2015. See below for a more detailed breakdown.

There are 323 projects over 1 MW in capacity, representing 1,028.5 MW or 44.7% of the qualified capacity. The largest projects in PJM are concentrated in NC and MD. There are 52 projects that are 5 MW or larger. These make up 22.4% of all qualified capacity in PJM. The top 5 largest projects are listed below.

NJ Office of Clean Energy Estimated Installed Capacity Through 6/30/15

On July 17, 2015, the New Jersey Office of Clean Energy (OCE) announced total installed solar capacity reached 1,500.7 MW through 6/30/15; an increase of approximately 14.4 MW over the total capacity reported through the end of May 2015. The average last six month build rate per month, according to the OCE data, is 11.5 MW. Note that this data does not directly tie to GATS registration data because of a lag between NJ Office of Clean Energy certifications and GATS registrations.

Overview of MA DOER SREC-I and SREC-II Eligible Systems

SREC-I Program

The Massachusetts SREC-I program was capped on June 30, 2014. As of 7/21/2015 the DOER reported that 6.7 MW of solar is still listed as Qualified but not operational. In total, 653.8 MW of capacity is listed as qualified, of which 647.1 MW is operational.

SREC-II Program

The SREC-II program opened on April 25, 2014. The program is broken in to Market Sectors. For a detailed overview of the regulations regarding SREC-II please visit here. As of 7/21/2015, 309.4 MW of capacity is currently qualified under the SREC-II program, but only 146.7 MW is operational.

Starting May 15, 2015 the DOER began publishing data showing generation units under review in the SREC-II Program.  Total capacity under Review is 57.2 MW, of which 26.1 MW is operational.

How to Interpret The Capacity Table at the Top of this Post

The tables above demonstrate the capacity breakout by state. Note, that for all PJM GATS registered projects, each state includes all projects certified to sell into that state. State RPS programs that allow for systems sited in other states to participate have been broken up by systems sited in-state and out-of-state. Additional detail has been provided to demonstrate the total capacity of systems only certified for one specific state market versus being certified for multiple state markets. For example, PA includes projects only certified to sell into the PA SREC market, broken out by in-state and out-of-state systems, as well as projects that are also certified to sell into PA and Other State markets broken out by in state and out of state systems (i.e. OH, DC, MD, DE, NJ). PA Out-of-State includes systems sited in states with their own state SREC market (i.e. DE) as well as systems sited in states that have no SREC market (i.e. VA). Also, it is important to note that the Current Capacity represents the total megawatts eligible to produce and sell SRECs as of the noted date, while the Estimated Required Capacity – Current and Next Reporting Year represents the estimated number of MW that need to be online on average throughout the reporting period to meet the RPS requirement within each state with only that particular compliance period vintage. For example, New Jersey needed approximately 496.7 MW online for the entire 2013 reporting year to meet the RPS requirement with 2013 vintage SRECs only. SRECs still available from prior eligible periods can also impact the Solar RPS requirements. Additionally, the data presented above does not include projects that are in the pipeline or currently going through the registration process in each state program. This data represents specifically the projects that have been approved for the corresponding state SREC markets as of the dates noted.

Note: SREC requirements for markets without fixed SREC targets have been forecast based on EIA Report “Retail Sales of Electricity by State by Provider” through 2013. Projected SRECs required utilizes the most recent EIA electricity data applying an average 1.0% growth rate per forecast year. The state’s RPS Solar requirement is then multiplied by forecast total electricity sales to arrive at projected SRECs required. Projected capacity required is based on a factor of 1,200 MWh in PJM states and 1,160 MWh in MA, generated per MW of installed capacity per year.

New Jersey SREC Prices Continue to Move Up

Posted July 16th, 2015 by SRECTrade.

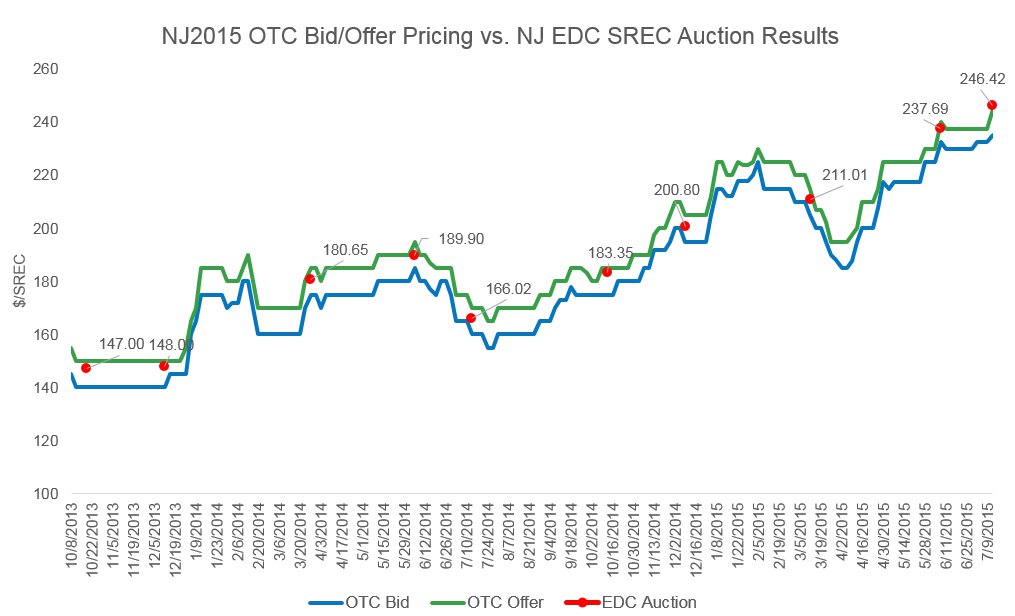
The New Jersey 2015 SREC market is currently bid $235/SREC. Since the beginning of Q2 2015, the market has steadily moved upward from $200/SREC. On July 15, 2015, the auction manager representing the NJ Electric Distribution Companies (EDC) announced a $246.42/SREC clearing price for the NJ2015 SREC auction held on July 14, 2015. 42,470 SRECs were sold at this price. What’s interesting about this most recent EDC auction is that it cleared above the offering side of the market. Historically, as shown below, the EDC auctions have traded between the bid and offer prices quoted in the over the counter (OTC) market around the time of the EDC auction close.

Screenshot_071515_084654_PM

The supply outlook, relative to demand, for reporting year 2016, appears to point to a flat market, meaning that there will likely be enough supply available from previous energy years and from SRECs issued throughout reporting year 2016. This assumes monthly solar build rates fall between 12.9 MW and 25.7 MW per month. Our presentation, from the Environmental Markets Association meeting this spring, shows various build rates relative to the NJ Solar RPS demand requirements. As shown below, in each Case 1-3, the under and oversupply estimated is close to zero meaning SREC supply will be close to balanced with the state’s RPS demand. Through May 2015, NJ solar monthly build rates have averaged 18.8 MW per month (over the last 6 months). June 2015 build rates are expected to be announced soon.

Screenshot_071515_084058_PM

Notes:

1) NJ2015 bid / offer pricing presented in chart above includes periods in which the market was quoted on a forward basis. The EDC clearing price presented at that time are for the most current spot vintage available for immediate delivery (i.e. 2014 EDC auction prices are presented against 2015 OTC Bid / Offer pricing in instances where 2015 SRECs weren’t available for sale in the EDC auction).

2) NJ Supply Demand Scenarios chart assumes electricity sales remain at the same level as reporting year 2014.

Administration Announces New Goals for Solar and Energy Efficiency

Posted July 15th, 2015 by SRECTrade.

On Tuesday, July 7th, the White House announced a new initiative designed to make solar electricity and solar industry jobs more accessible to low income households.  The official White House Press Release can be found HERE.

Program Overview:

The proposed initiative is designed to deploy clean, renewable energy that will reduce carbon emissions while creating jobs. Some of the highlights of the announcement include the following:

  • Establishing a National Community Solar Partnership that will provide opportunities for the 50% of households and businesses that lack the roof space or ownership necessary for solar energy.
  • Providing technical assistance to make solar installation on Affordable Housing easier.
  • Developing a Toolkit to increase the ability of states to use federal funding to deploy solar on affordable housing.
  • Funding AmeriCorp and the Solar Ready Vets Program to train workers for solar industry jobs and to deploy solar in impoverished areas.

Earlier this year, President Obama announced a goal to train 75,000 new workers to enter the solar industry by 2020. In line with this goal, President Obama issued an executive action to install 300 MW of new solar capacity on federally subsidized housing by 2020, expanding the Administration’s previous goals to also include community and shared solar installations.

In addition to the federal goals, some states (including MA, CA, HI, VT, WA, and DC), cities, and leaders in the private sector have also committed to investing more than $520 million to advance community solar or scale up solar and energy efficiency in low- and moderate- income communities.

Illinois Supplemental PV Procurement Results – Round 1 June 2015

Posted July 10th, 2015 by SRECTrade.

In June 2015, SRECTrade participated in the first round of the Illinois 2015 PV Procurement Program. SRECTrade was among the 7 winning suppliers of the 5-year SREC contracts awarded through the procurement program. For the IPA’s official announcement, click HERE.

Screenshot_071015_111939_AM

SRECTrade Markets Report: May 2015

Posted June 25th, 2015 by SRECTrade.

The following post is a monthly update outlining the megawatts of solar capacity certified to create SRECs in the Solar REC markets that SRECTrade serves. All PJM data is based on the information available in PJM GATS as of the date noted. All MA data is based on the information provided by the DOER as of the date noted. This analysis does not include projects that are not yet registered and certified with the entities noted herein.

A PDF copy of this table can be found here.

Capacity_May2015

Overview of PJM Eligible Systems Through 6/4/2015

There are 61,869 facilities registered in GATS as of 6/4/2015. See below for a more detailed breakdown.

There are 316 projects over 1 MW in capacity, representing 1,005.5 MW or 44.5% of the qualified capacity. The largest projects in PJM are concentrated in NC and MD. There are 50 projects that are 5 MW or larger. These make up 22.3% of all qualified capacity in PJM. The top 5 largest projects are listed below.

Screenshot_062515_072740_AM

NJ Office of Clean Energy Estimated Installed Capacity Through 5/31/15

On June 9, 2015, the New Jersey Office of Clean Energy (OCE) announced total installed solar capacity reached 1,486.3 MW through 5/31/15; an increase of approximately 7.5 MW over the total capacity reported through the end of April 2015. The average last six month build rate per month, according to the OCE data, is 18.8 MW. Note that this data does not directly tie to GATS registration data because of a lag between NJ Office of Clean Energy certifications and GATS registrations.

Overview of MA DOER SREC-I and SREC-II Eligible Systems

SREC-I Program

The Massachusetts SREC-I program was capped on June 30, 2014. As of 6/15/2015 the DOER reported that 6.7 MW of solar is still listed as Qualified but not operational. In total, 653.8 MW of capacity is listed as qualified, of which 647.1 MW is operational.

SREC-II Program

The SREC-II program opened on April 25, 2014. The program is broken in to Market Sectors. For a detailed overview of the regulations regarding SREC-II please visit here. As of 6/15/2015, 288.5 MW of capacity is currently qualified under the SREC-II program, but only 132.7 MW is operational.

Starting May 15, 2015 the DOER began publishing data showing generation units under review in the SREC-II Program.  Total capacity under Review is 59.0 MW, of which 25.1 MW is operational.

How to Interpret The Capacity Table at the Top of this Post

The tables above demonstrate the capacity breakout by state. Note, that for all PJM GATS registered projects, each state includes all projects certified to sell into that state. State RPS programs that allow for systems sited in other states to participate have been broken up by systems sited in-state and out-of-state. Additional detail has been provided to demonstrate the total capacity of systems only certified for one specific state market versus being certified for multiple state markets. For example, PA includes projects only certified to sell into the PA SREC market, broken out by in-state and out-of-state systems, as well as projects that are also certified to sell into PA and Other State markets broken out by in state and out of state systems (i.e. OH, DC, MD, DE, NJ). PA Out-of-State includes systems sited in states with their own state SREC market (i.e. DE) as well as systems sited in states that have no SREC market (i.e. VA). Also, it is important to note that the Current Capacity represents the total megawatts eligible to produce and sell SRECs as of the noted date, while the Estimated Required Capacity – Current and Next Reporting Year represents the estimated number of MW that need to be online on average throughout the reporting period to meet the RPS requirement within each state with only that particular compliance period vintage. For example, New Jersey needed approximately 496.7 MW online for the entire 2013 reporting year to meet the RPS requirement with 2013 vintage SRECs only. SRECs still available from prior eligible periods can also impact the Solar RPS requirements. Additionally, the data presented above does not include projects that are in the pipeline or currently going through the registration process in each state program. This data represents specifically the projects that have been approved for the corresponding state SREC markets as of the dates noted.

Note: SREC requirements for markets without fixed SREC targets have been forecast based on EIA Report “Retail Sales of Electricity by State by Provider” through 2013. Projected SRECs required utilizes the most recent EIA electricity data applying an average 1.0% growth rate per forecast year. The state’s RPS Solar requirement is then multiplied by forecast total electricity sales to arrive at projected SRECs required. Projected capacity required is based on a factor of 1,200 MWh in PJM states and 1,160 MWh in MA, generated per MW of installed capacity per year.

Illinois Supplemental PV Procurement Program – Application Webinar Recording

Posted May 29th, 2015 by SRECTrade.

On May 28, 2015, SRECTrade hosted a webinar for the Illinois Supplemental PV Procurement Program. The webinar covered the following:

  • Overview of the IL SREC program
  • Live demonstration of the registration and bid process
  • Example aggregate bid groups
  • Procurement timeline
  • Installer management tool overview
  • Q&A

For the presentation slides click here. To view a recording, see below:

The application and registration process opens on Friday, May 29th and will close on Thursday, June 11th. Contact us by email: clientservices@srectrade.com or by phone: 877-466-4606 with any questions.

Note: The presentation was updated to amend the bid results announcement to fall between June 24-25th; subject to notice from the Illinois Power Agency (IPA)

Environmental Markets Association – PA, NJ, and MD SREC Presentation

Posted May 28th, 2015 by SRECTrade.

Last week, SRECTrade was invited to present at the Northeast Renewable Energy Credit Round Table hosted by the Environmental Markets Association (EMA).  The presentation provides a fundamental look into the PA, NJ and MD SREC markets.

The presentation covers the following topics on each state SREC program.

  • Current Installed Solar Capacity
  • Supply and Demand
  • Recent Pricing

Feel free to contact us with any questions.

Screenshot_052815_084018_PM

SRECTrade Markets Report: April 2015

Posted May 27th, 2015 by SRECTrade.

The following post is a monthly update outlining the megawatts of solar capacity certified to create SRECs in the Solar REC markets that SRECTrade serves. All PJM data is based on the information available in PJM GATS as of the date noted. All MA data is based on the information provided by the DOER as of the date noted. This analysis does not include projects that are not yet registered and certified with the entities noted herein.

A PDF copy of this table can be found here.

Capacity_April2015

Overview of PJM Eligible Systems Through 5/14/2015

There are 60,643 facilities registered in GATS as of 5/14/2015. See below for a more detailed breakdown.

GATS overview amended

There are 314 projects over 1 MW in capacity, representing 1,002.4 MW or 44.6% of the qualified capacity. The largest projects in PJM are concentrated in NC and MD. There are 50 projects that are 5 MW or larger. These make up 22.4% of all qualified capacity in PJM. The top 5 largest projects are listed below.

Top 5 amended

NJ Office of Clean Energy Estimated Installed Capacity Through 4/30/15

On May 12, 2015, the New Jersey Office of Clean Energy (OCE) announced total installed solar capacity reached 1,478.8 MW through 4/30/15; an increase of approximately 9.1 MW over the total capacity reported through the end of March 2015. The average last six month build rate per month, according to the OCE data, is 18.9 MW. Note that this data does not directly tie to GATS registration data because of a lag between NJ Office of Clean Energy certifications and GATS registrations.

Overview of MA DOER SREC-I and SREC-II Eligible Systems

SREC-I Program

The Massachusetts SREC-I program was capped on June 30, 2014. As of 5/15/2015 the DOER reported that 8.0 MW of solar is still listed as Qualified but not operational. In total, 654.4 MW of capacity is listed as qualified, of which 646.4 MW is operational.

SREC-II Program

The SREC-II program opened on April 25, 2014. The program is broken in to Market Sectors. For a detailed overview of the regulations regarding SREC-II please visit here. As of 4/15/2015, 272.8 MW of capacity is currently qualified under the SREC-II program, but only 118.6 MW is operational.

Starting May 15, 2015 the DOER began publishing data showing generation units under review in the SREC-II Program.  Total capacity under Review is 72.4 MW, of which 23.0 MW is operational.

How to Interpret The Capacity Table at the Top of this Post

The tables above demonstrate the capacity breakout by state. Note, that for all PJM GATS registered projects, each state includes all projects certified to sell into that state. State RPS programs that allow for systems sited in other states to participate have been broken up by systems sited in-state and out-of-state. Additional detail has been provided to demonstrate the total capacity of systems only certified for one specific state market versus being certified for multiple state markets. For example, PA includes projects only certified to sell into the PA SREC market, broken out by in-state and out-of-state systems, as well as projects that are also certified to sell into PA and Other State markets broken out by in state and out of state systems (i.e. OH, DC, MD, DE, NJ). PA Out-of-State includes systems sited in states with their own state SREC market (i.e. DE) as well as systems sited in states that have no SREC market (i.e. VA). Also, it is important to note that the Current Capacity represents the total megawatts eligible to produce and sell SRECs as of the noted date, while the Estimated Required Capacity – Current and Next Reporting Year represents the estimated number of MW that need to be online on average throughout the reporting period to meet the RPS requirement within each state with only that particular compliance period vintage. For example, New Jersey needed approximately 496.7 MW online for the entire 2013 reporting year to meet the RPS requirement with 2013 vintage SRECs only. SRECs still available from prior eligible periods can also impact the Solar RPS requirements. Additionally, the data presented above does not include projects that are in the pipeline or currently going through the registration process in each state program. This data represents specifically the projects that have been approved for the corresponding state SREC markets as of the dates noted.

Note: SREC requirements for markets without fixed SREC targets have been forecast based on EIA Report “Retail Sales of Electricity by State by Provider” through 2013. Projected SRECs required utilizes the most recent EIA electricity data applying an average 1.0% growth rate per forecast year. The state’s RPS Solar requirement is then multiplied by forecast total electricity sales to arrive at projected SRECs required. Projected capacity required is based on a factor of 1,200 MWh in PJM states and 1,160 MWh in MA, generated per MW of installed capacity per year.

Maryland Community Shared Solar Legislation Signed

Posted May 27th, 2015 by SRECTrade.

Maryland Governor, Larry Hogan, recently signed HB1087 and SB398. The bills help make community shared solar possible in the state of Maryland.

Community Shared Solar Overview

Community shared solar is a way for residents and businesses who could not otherwise go solar to benefit from the various financial, energy saving, and environmental advantages of solar energy. Community members can own a portion of a nearby solar installation and subsequently receive financial or energy savings through credits to their utility bill. Community shared solar is important because it gives homeowners and business with unsuitable roofs the opportunity to procure power from distributed generation solar resources. Also, individuals or businesses renting a home or office can also benefit from the community solar utility bill crediting system. Community solar could have a substantial impact on a large number of people that are not able to go solar. In a recent report, the Department of Energy and NREL estimate that 49% of households and 48% of businesses are unable to go solar because they lack sufficient roof space or are renters.

Maryland Community Shared Solar Program Details

The pilot program will run for three years, during which the state will see its first community shared solar projects built.

The program allows for utility ownership of community solar projects and also requires that utilities buy back unused electricity from privately developed solar facilities. Similar to other photovolatic (PV) and solar thermal projects, community solar projects in the state will participate in the Maryland Solar Renewable Energy Credit (SREC) program.

In addition to the pilot program, the state will study the costs & benefits of community shared solar to Maryland. The study is intended to provide the basis for a General Assembly vote to create a permanent community shared solar program.