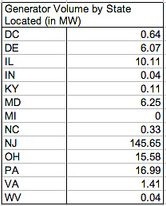
At the end of September, Pennsylvania lawmakers introduced HB 1128. The main focus of the bill is to amend the requirements under PA’s Alternative Energy Portfolio Standards (AEPS) by increasing the amount of renewable energy to come from Tier I alternative energy sources and Solar Photovoltaic technologies. In addition to increasing the requirements, HB 1128 attempts to amend the program by introducing a fixed alternative compliance payment (ACP) for the Solar PV portion of the AEPS. Currently, the ACP under the PA solar carve-out is derived based on 200% of the average SREC price paid by buyers during the reporting year. The ACP in RY2008 and RY2009 was $528.17 and $550.15 per MWh, respectively. The table below demonstrates the the key changes to the solar requirements, attempting to increase the total requirement 3 times the current level by the 2022 energy year.

Positive Impacts of HB 1128
The increase in PV capacity would help support the growing solar economy in Pennsylvania and provide more room under the current requirements for more solar to come to market. The current PA market has over 2,900 solar projects registered and eligible for the AEPS program. The total nameplate capacity of these projects is equal to 51.8 MW. Of these 2,900 projects only four projects are greater than 1 MW. In addition to being eligible for the PA SREC market, many of these facilities could also be registered in other states such as Ohio and Washington D.C.
The current capacity of solar projects eligible for the PA market is greater than the requirements for the current energy year. The implementation of HB 1128 would allow for the solar market to continue to grow and support the development of projects of all sizes, from small rooftop residential to larger multi-MW utility scale solar systems. Pennsylvania’s inability to implement some sort of amendment to increase the solar RPS requirements could result in a migration of PA’s solar industry to other surrounding states such as New Jersey, Maryland, and Delaware which have all recently increased the requirements of their solar RPS programs and maintain fixed alternative compliance payment schedules. It has been estimated that the increase in the AEPS program could create at least 14,000 jobs over the next ten years. A stronger solar policy in PA will not only help create new, clean energy focused jobs, but will help move the state towards a more energy independent future.
Compared to HB 2405, the treatment of out-of-state facilities is not addressed in HB 1128. Though the future acceptance of out-of-state facilities can be left up to the lawmakers to debate, the major problem with HB 2405 was that it excluded existing facilities from neighboring states that have been financed based on being accepted into the SREC program in Pennsylvania. This disregard for the existing out-of-state facilities is unacceptable. Fortunately, HB 1128 does not address this issue. Any future Bill to address this topic should at the very least grandfather in any previously approved facilities.
Negative Impact of HB 1128
Despite the need for an increased requirement, PA HB 1128 may not be the answer because of the low ACPs that are included in the Bill. It could depress SREC market pricing to levels that could be prohibitive to the economics of solar today. There are few financeable projects at SREC values below $200, especially when there is limited access to long-term contracts. Compared to other state markets, PA would have the lowest ACP and be heading in the opposite direction of states like Delaware, Maryland and New Jersey that have increased the fines to encourage growth and discourage electricity suppliers from paying the ACP.
Pennsylvania’s Current ACP
Meanwhile, the current ACP in Pennsylvania has not been implemented the way it was intended, which could have an impact on the market in the long run. The way the law was written, the intent was to fine electricity suppliers 200% of the average SREC purchase price in the PJM region. i.e. keeping them in check with neighboring state markets. Most likely because this was somewhat vague and difficult to calculate, the ACP was interpreted differently by the organizations implementing the program. Instead of being fined based on neighboring state markets, the interpretation of the ACP was that since Pennsylvania accepted SRECs from throughout the PJM region, it was a fair indication of the average price in the region. Therefore, Pennsylvania uses an ACP of 200% of the average price paid for compliance in Pennsylvania. Instead of keeping buyers in the PA market in check with other states, the ACP in Pennsylvania keeps buyers in check with themselves. The goal for buyers in Pennsylvania is to keep the average price down, so that the fines will remain low in non-compliance years. In reality, the price paid will ultimately have to be just enough to get a project done, though the market would be far more stable if the ACP were implemented as it was originally intended.
Click here for a link to the HB 1128 summary.
Tweet

