
SRECTrade SREC Markets Report: March 2013
The following post is a monthly update outlining the megawatts of solar capacity certified to create SRECs in the Solar REC markets that SRECTrade currently serves. All PJM data is based on the information available in PJM GATS as of the date noted. All MA data is based on the information provided by the DOER as of the date noted. This analysis does not include projects that are not yet registered and certified with the entities noted herein.
A more detailed analysis of supply, demand and price trends in the SREC markets can be found in the SREC Market Monitor, a joint-venture between SRECTrade and Greentech Media’s GTM Research.
A PDF copy of this table can be found here.
***NJ Capacity Update as of 3/31/13*** Through March 2013 NJ installed capacity reached approximately 1,026 MW of installed solar capacity; a 18 MW increase over the prior month. The number in the table above represents all capacity registered in GATS as of the date noted. The remaining capacity will be registered and receive SREC credit from the date of project interconnection.
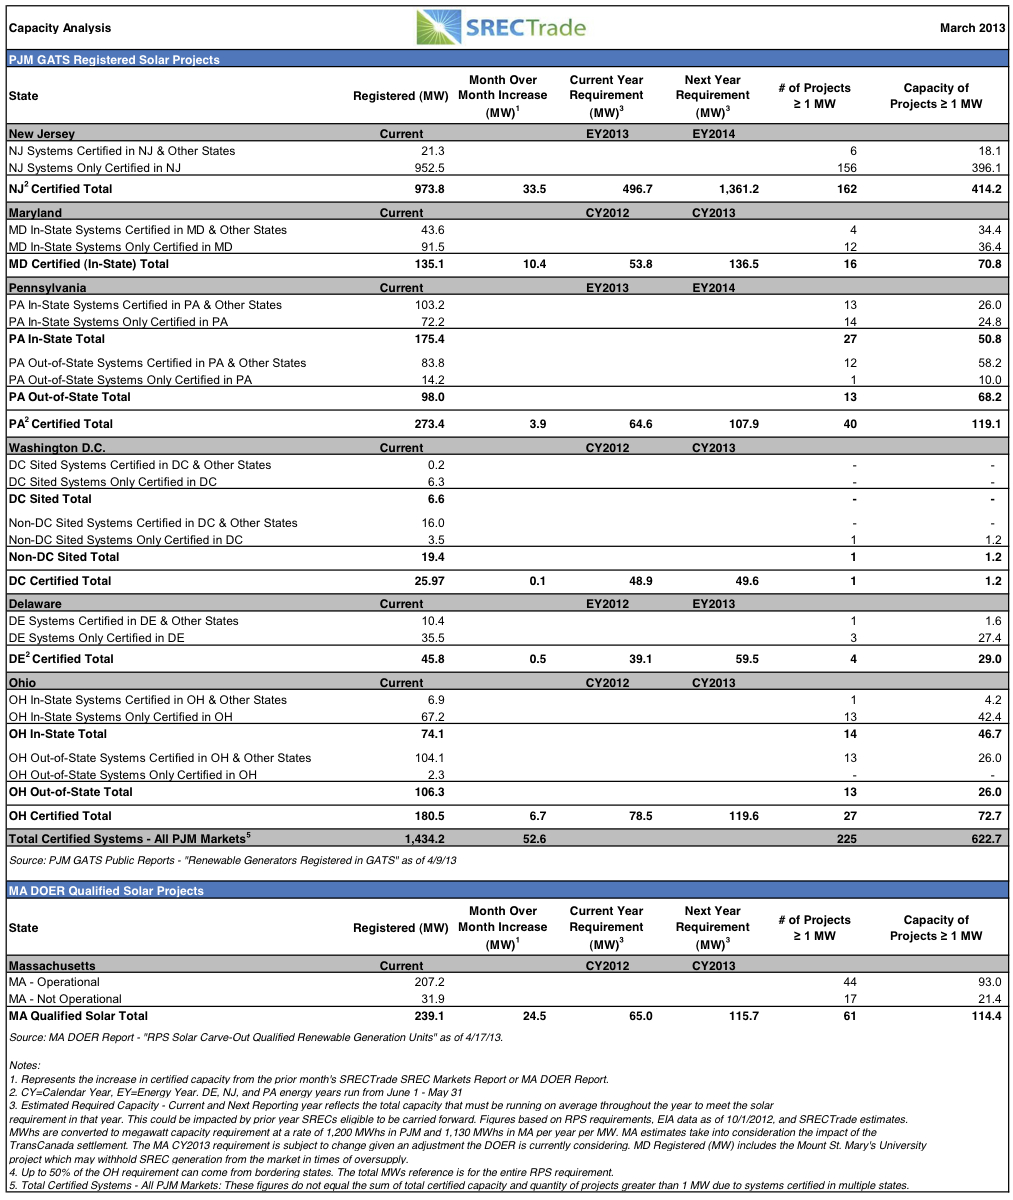
Overview of PJM Eligible Systems
As of April 9, 2013 there were 33,116 solar PV and 679 solar thermal systems registered and eligible to create SRECs in the PJM Generation Attribute Tracking System (GATS). Of these, 225 (0.67%) have a nameplate capacity of 1 megawatt or greater. Twenty-four of these projects have a nameplate capacity of 5 MW or greater. New Jersey continues to host most of the larger scale facilities, claiming home to 62.5% of the projects, 15 of 24 facilities, that are equal to or greater than 5 MW. The three largest projects are a 29.1 MW FirstSolar project in MD, the 25.1 MW PSE&G utility pole mount project located in NJ, and the 16.1 MW Mount St. Mary’s project in MD.
Massachusetts DOER Qualified Projects
As of April 17, 2013, there were 5,532 MA DOER qualified solar projects; 5,485 operational and 47 not operational. Total qualified capacity is 239.1 MW, 207.2 MW of which is operational and 31.9 MW not operational. Electricity suppliers providing power to the state need to acquire approximately 73,400 SRECs in 2012. According to NEPOOL GIS, 119,247 MA2012 SRECs have been issued for the current compliance year.
How to Interpret This Table
The tables above demonstrate the capacity breakout by state. Note, that for all PJM GATS registered projects, each state includes all projects certified to sell into that state. State RPS programs that allow for systems sited in other states to participate have been broken up by systems sited in-state and out-of-state. Additional detail has been provided to demonstrate the total capacity of systems only certified for one specific state market versus being certified for multiple state markets. For example, PA includes projects only certified to sell into the PA SREC market, broken out by in-state and out-of-state systems, as well as projects that are also certified to sell into PA and Other State markets broken out by in state and out of state systems (i.e. OH, DC, MD, DE, NJ). PA Out-of-State includes systems sited in states with their own state SREC market (i.e. DE) as well as systems sited in states that have no SREC market (i.e. VA). Also, it is important to note that the Current Capacity represents the total megawatts eligible to produce and sell SRECs as of the noted date, while the Estimated Required Capacity – Current and Next Reporting Year represents the estimated number of MW that need to be online on average throughout the reporting period to meet the RPS requirement within each state with only that particular compliance period vintage. For example, New Jersey needed approximately 496.7 MW online for the entire 2013 reporting year to meet the RPS requirement with 2013 vintage SRECs only. SRECs still available from prior eligible periods can also impact the Solar RPS requirements. Additionally, the data presented above does not include projects that are in the pipeline or currently going through the registration process in each state program. This data represents specifically the projects that have been approved for the corresponding state SREC markets as of the dates noted.
Note: SREC requirements for markets without fixed SREC targets have been forecast based on EIA Report “Retail Sales of Electricity by State by Provider” updated 10/1/12. Projected SRECs required utilizes the most recent EIA electricity data applying an average 1.5% growth rate per forecast year. The state’s RPS Solar requirement is then multiplied by forecast total electricity sales to arrive at projected SRECs required. Projected capacity required is based on a factor of 1,200 MWh in PJM states and 1,130 MWh in MA, generated per MW of installed capacity per year.
Tweet


")


